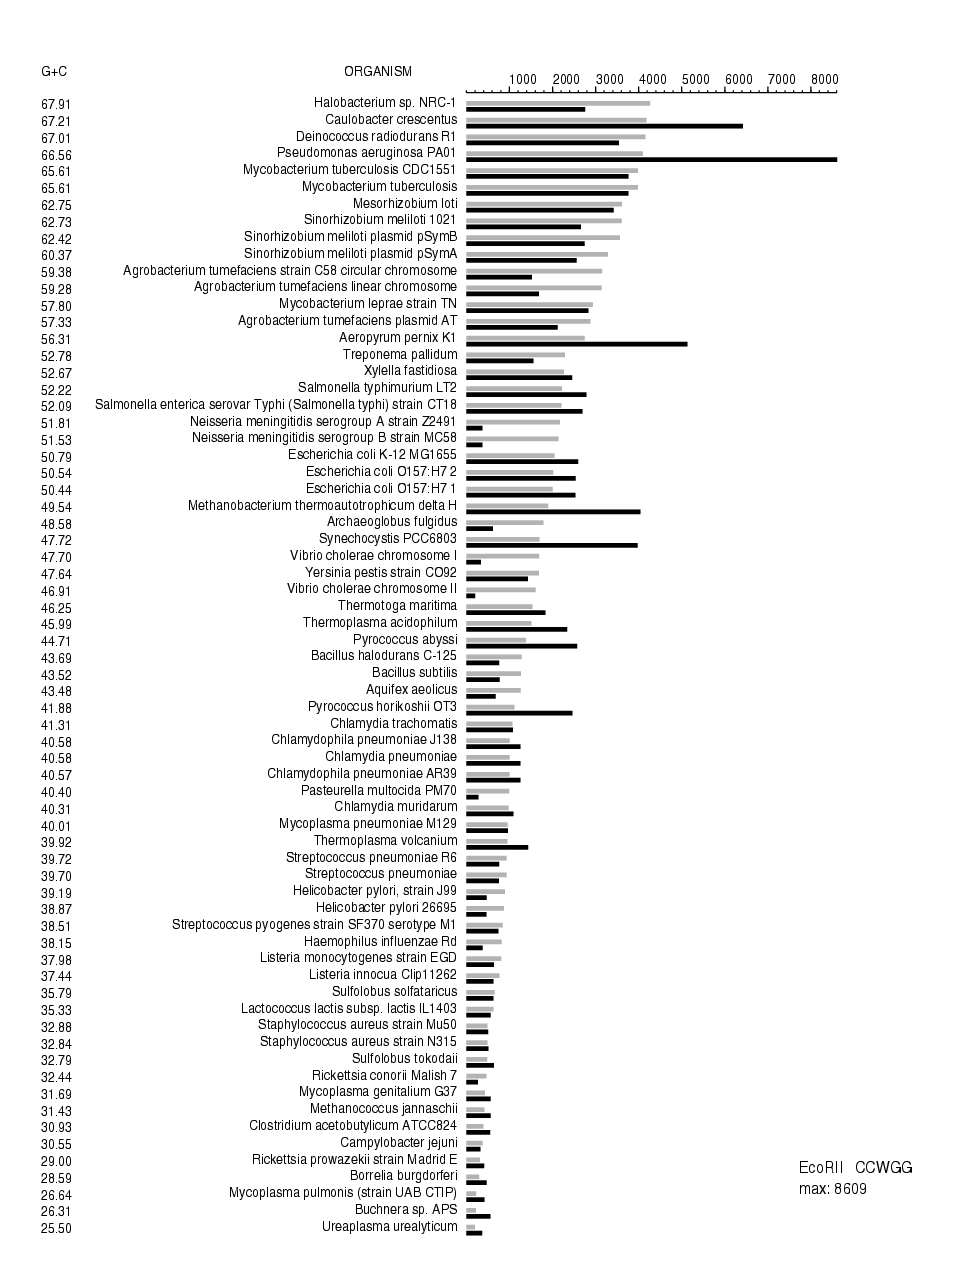
Legend: Number of observed (black bars) and expected (gray bars) frequencies of restriction enzyme recognition sites are shown, for each finished genome. Expected values are calculated from nucleotide frequencies. Genomes are ranked by their G+C contents.
|
|